Thursday, 14 November 2013

Presentations, presentations, presentations...

Scruffy Duck helps me prepare my slides before LCPD13, Malta
Long time, no post and all that - but I'm still here!

The past few months have been a bit busy, what with the RDA Second Plenary, the DataCite Summer Meeting, and the CODATA and Force 11 Task Groups on Data Citation meetings in Washington DC, followed by Linking and Contextualising Publications and Datasets, in Malta, and a quick side trip to CERN for the ODIN codesprint and first year conference. (My slides from the presentations at the DataCite, LCPD and ODIN meetings are all up on their respective sites.)

On top of that I also managed to decide it'd be a good idea to apply for a COST Action on data publication. Thankfully 48 other people from 25 different countries decided that it'd be a good idea too, and the proposal got submitted last Friday (and now we wait...) Oh, and I put a few papers in for the International Digital Curation Conference being held in San Francisco in February next year.

Anyway, they're all my excuse for not having blogged for a while, despite the list I've been building up of things to blog about. This post is really by way of an update, and also to break the dry spell. Normal service (or whatever passes for it 'round these parts) will be resumed shortly.

And just to make it interesting, a couple of my presentations this year were videoed. So, you can hear me present about the CODATA TG on data citation's report "Out of Cite, Out of Mind" here. And the lecture I gave on data management for the OpenAIRE workshop May 28, Ghent Belgium can be found here.

Friday, 6 September 2013

My Story Collider story - now available for all your listening needs

Way back last year, I was lucky/brave/foolhardy enough to take part in a Story Collider event where I stood on stage in front of a microphone and told a story about my life in science*.

And here is that very recording! With many thanks to the fine folk at the Story Collider for agreeing to let me post it on my blog.


_________________
*This was right in the middle of my three month long missing voice period, so I sound a bit croaky.

Monday, 12 August 2013

How to review a dataset: a couple of case studies

"Same graph as last year, but now I have an additional dot"
http://vadlo.com/cartoons.php?id=149

As part of the PREPARDE project, I've been doing some thinking recently about how exactly one would go about peer-reviewing data. So far, the project (and friends and other interested parties) have come up with some general principles, which are still being discussed and will be published soon. 

Being more of a pragmatic and experimental bent myself, I thought I'd try to actually review some publicly accessible datasets out there and see what I could learn from the process. Standard disclaimers: with a sample size of 2, and an admittedly biased way of choosing what datasets to review, this is not going to be statistically valid!

I'm also bypassing a bit of the review process that would probably be done by the journal's editorial assistant, asking important questions like: 
  • Does the dataset have a permanent identifier? 
  • Does it have a landing page (or README file or similar) with additional information/metadata, which allows you to determine that this is indeed the dataset you're looking for?
  • Is it in an accredited/trusted repository?*
  • Is the dataset accessible? If not, are the terms and conditions for access clearly defined?
If the answer to any of those questions is no, then the editorial assistant should just bounce the dataset back to the author without even sending it to scientific review, as the poor scientific reviewer will have no chance of either accessing the data, or understanding it.

In my opinion, the main purpose of peer-review of data is to check for obvious mistakes and determine if the dataset (or article) is of value to the scientific community. I also err on the side of pragmatism - for most things, quality is assessed over the long term by how much the thing is used. Data's no different. So, for the most part, the purpose of the scientific peer review is to determine if there's enough information with the data to allow it to be reused.

Dataset 1: Institute of Meteorology and Geophysics (2013): Air temperature and precipitation time series from weather station Obergurgl, 1953-1959. University of Innsbruck, doi:10.1594/PANGAEA.806618,


I found this dataset by going to Pangaea.de and typing "precipitation" into their search box, and then looking at the search results until I found a title that I liked the sound of and thought I'd have the domain expertise to review. (Told you the process was biased!)

Then I started poking around an asking myself a few questions:
  • Are the access terms an conditions appropriate? 
    • Open access and downloadable with a click of a button, so yes. It also clearly stated that the license for the data is CC-BY 3.0
  • Is the format of the data acceptable? 
    • You can download the dataset as tab-delimited text in a wide variety of standards that you can choose from a drop down menu. You can also view the first 2,000 rows in a nicely formatted html table on the webpage.
  • Does the format conform to community standards?
    • I'm used to stuff in netCDF, but I suspect tab delimited text is more generic.
  • Can I open the files and view the data? (If not, reject straight away)
    • I can view the first 2,000 lines on the webpage. Downloading the file was no problem, but the .tab extension confused my computer. I tried opening it in notepad first (which looked terrible) but then quickly figured out that I could open the file in Excel and it would format it nicely for me.
  • Is the metadata appropriate? Does it accurately describe the data?
    • Yes. I can't spot any glaring errors, and short of going to the measurement site itself and measuring, I have to trust that the latitude and longitude are correct, but that's to be expected.
  • Are there unexplained/non-standard acronyms in the dataset title/metadata?
    • No. I like the way parameter DATE/TIME is linked out to a description of the format that it follows.
  • Is the data calibrated? If so, is the calibration supplied?
    • No mention of callibration, but these are old measurements from the 1950s, so I'm not surprised.
  • Is information/metadata given about how/why the dataset was collected? (This may be found in publications associated with the dataset)
  • Are the variable names clear and unambiguous, and defined (with their units)?
    • Yes, in a Parameter(s) table on the landing page. I'm not sure why they decided to call temperature "TTT", but it's easy enough to figure out, given the units are given next to the variable name. 
    • It also took me a minute to figure out what the 7-21h and 21-7h meant in the table next to the Precipitation, sum - but looking at the date/time of the measurements made me realise that it meant the precipitation was summed over the time between 7am and 9pm for one measurement and 9pm and 7am (the following morning) for the other - an artefact of when the measurements were actually taken.
    • The metadata gives the height above ground of the sensor, but doesn't give the height above mean sea level for the measurements station - you have to go to the dataset collection page to find that out. It does say that location is in the Central Alps though.
  • Is there enough information provided so that data can be reused by another researcher?
    • Yes, I think so
  • Is the data of value to the scientific community? 
    • Yes, it's measurement data that can't be repeated.
  • Does the data have obvious mistakes? 
    • Not that I can see. The precision of the precipitation measurement is 0.1mm, which is small, but plausible. 
  • Does the data stay within expected ranges?
    • Yes. I can't spot any negative rainrates, or temperatures in the minus values in the middle of summer.
  • If the dataset contains multiple data variables, is it clear how they relate to each other?
    • Yes - the temperature and precipitation measurements are related according to the time of the measurement. 
Verdict: Accept. I'm pretty sure I'd be able to use this data, if I ever needed precipitation measurements from the 1950s in the Austrian Alps.

I found this dataset in a versy similar way as before, i.e. by going to figshare.com and typing "precipitation" into their search box, ticking the box in the advance search to restrict to datasets, and then picking the first appropriate sounding title.

At first glance, I haven't a clue what this dataset is about. The data itself is easily viewed on the webpage as a table with some location codes (explained a bit in the description - I think they're in the USA?) and some figures for annual rainfall and coefficients of variation.

Going through my questions:
  • Are the access terms an conditions appropriate? 
    •  Don't know. It's obviously open, but I don't know what license it's under (if any)
  • Is the format of the data acceptable? 
    •  I can easily download it as an Excel spreadsheet (make comments as you'd like regarding Excel and proprietary formats and backwards compatibility...)
  • Does the format conform to community standards?
    •  No, but I can open them easily, so it's not too bad
  • Can I open the files and view the data? (If not, reject straight away)
    •  Yes
  • Is the metadata appropriate? Does it accurately describe the data?
    •  No
  • Are there unexplained/non-standard acronyms in the dataset title/metadata?
    •  Yes
  • Is the data calibrated? If so, is the calibration supplied?
    •  No idea
  • Is information/metadata given about how/why the dataset was collected? (This may be found in publications associated with the dataset)
  • Are the variable names clear and unambiguous, and defined (with their units)?
    •  No
  • Is there enough information provided so that data can be reused by another researcher?
    •  No
  • Is the data of value to the scientific community? 
    •  I have no idea
  • Does the data have obvious mistakes? 
    •  No idea
  • Does the data stay within expected ranges?
    •  Well, there's no minus rainfall - other than that, who knows?
  • If the dataset contains multiple data variables, is it clear how they relate to each other?
    •  Not clear
Verdict: Reject. On the figshare site, there simply isn't enough metadata to review the dataset, or even figure out what the data is. Yes, "Annual rainfall (mm)" is clear enough, but that makes me ask: for what year? Or is is averaged? Or what?

But! Looking at the paper which is linked to the dataset reveals an awful lot more information. This dataset is the figures behind table 1 of the paper, shared in a way that makes them easier to use in other work (which I approve of). The paper also has a paragraph about the precipitation data in the table, describing what it is and how it was created. 

It turns out the main purpose of this dataset was to study the plant resource use by populations of desert tortoises (Gopherus agassizii) across a precipitation gradient in the Sonoran Desert of Arizona, USA. And, from the look of the paper (very much outside my field!) it did the job it was supposed to, and might be of use for other people studying animals in that region. My main concern is if that dataset ever becomes disconnected from that paper, then the dataset as it is now would be pretty much worthless.

Here's a picture of a desert tortoise:
File:DesertTortoise.JPG
Desert Tortoise (Gopherus agassizii) in Rainbow Basin near Barstow, California. Photograph taken by Mark A. Wilson (Department of Geology, The College of Wooster). Public Domain

Conclusions

So, what have I learned from this little experiment?
  1. There's an awful lot of metadata and information in a journal article that relates to a dataset (which is good) and linking the two is vital if you're not going to duplicate information from the paper in the same location as the dataset. BUT! if the link between the dataset and the paper is broken, you've lost all the information about the dataset, rendering it useless.
  2. Having standard (and possibly mandatory) metadata fields which have to be filled out before the dataset is stored in the repository means that you've got a far better chance of being able to understand the dataset without having to look elsewhere for information (that might be spread across multiple publications). The down side of this is that it increases the effort needed to deposit the data in the repository, duplicates metadata and may increase the chances of error (when metadata with the dataset is different from that in the publication).
  3. I picked a pair of fairly easy datasets to review, and it took me about 3 hours (admittedly, there was a large proportion of that which was devoted to writing this post). 
  4. Having a list of questions to answer does help very much with the data review process. The questions above are ones I've come up with myself, based on my knowledge of datasets and also of observational measurements. They'll not be applicable for every scientific domain, so I think they're only really guidelines. But I'd be surprised if there weren't some common questions there.
  5. Data review probably isn't as tricky as people are worried. Besides, there's always the option of rejecting stuff out of hand, if, for example, you can't open the downloaded data file. It's the dataset authors' responsibility (with some help from the data repository) to make the dataset usable and understandable if they want it to be published.
  6. Searching for standard terms like "precipitation" in data repositories can return some really strange results.
  7. Desert tortoises are cute!
I'd very much like to thank the authors who's datasets I've reviewed (assuming they ever see this). They put their data out there, open to everyone, and I'm profoundly grateful! Even in the case where I'd reject the dataset as not being suitable to publish in a data journal, I still think the authors did the right thing in making it available, seeing as it's an essential part of another published article.
______
* Believe me, we've had a lot of discussions about what exactly it means to be an accredited/trusted repository. I'll be blogging about it later.


Monday, 17 June 2013

NFDP13: Plenary Panel Two: Where do we want to go?


This is my final post about the Now and Future of Data Publishing symposium and is a write-up of my speaking notes from the last plenary panel of the day.

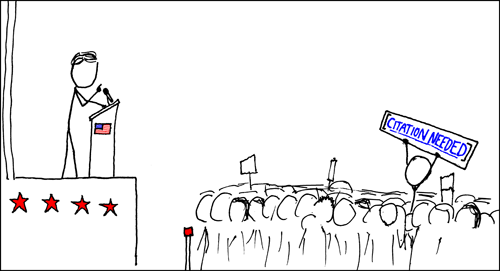
As before, I didn't have any slides, but used the above xkcd picture as a backdrop, because I thought it summed things up nicely!

My topic was: "Data and society - how can we ensure future political discussions are evidence led?"

"I work for the British Atmospheric Data Centre, and we happen to be one of the data nodes hosting the data from the 5th Climate Model Intercomparison Project (CMIP5). What this means is that we're hosting and managing about 2 Petabytes worth of climate model output, which will feed into the next Intergovernmental Panel on Climate Change's Assessment Report and will be used national and local governments to set policy given future projections of climate change.

But if we attempted to show politicians the raw data from these model runs, they'd probably need to go and have a quiet lie down in a darkened room somewhere. The raw data is just too much and too complicated, for anyone other than the experts. That's why we need to provide tools and services. But we also need to keep the raw data so the outputs of those tools and services can be verified.

Communication is difficult. It's hard enough to cross scientific domains, let alone the scientist/non-scientist divide. A repositories, we collect metadata bout the datasets in our archives, but this metadata is often far to specific and specialised for a member of the general public or a science journalist to understand. Data papers allow users to read the story of the dataset and find out details of how and why it was made, while putting it into context. And data papers are a lot easier for humans to read that an xml catalogue page.

Data publication can help us with transparency and trust. Politicians can't be scientific experts - they need to be political experts. So they need to rely on advisors who are scientists or science journalists for that advice - and preferably more than one advisor.

Making researchers' data open means that it can be checked by others. Publishing data (in to formal data journal sense) means that it'll be peer-reviewed, which (in theory at least) will cut down on fraud. It's harder to fake a dataset than a graph - I know this personally, because I spent my PhD trying to simulate radar measurements of rain fields, with limited success!)

With data publishing, researchers can publish negative results. The dataset is what it is and can be published even if it doesn't support a hypothesis - helpful when it comes to avoiding going down the wrong research track.

As for what we, personally can do? I'd say: lead by example. If you're a researcher, be open with your data (if you can. Not all data should be open, for very good reason, for example if it's health data and personal details are involved). If you're and editor, reviewer, or funder, simply ask the question: "where's the data?"

And everyone: pick on your MP. Query the statistics reported by them (and the press), ask for evidence. Remember, the Freedom of Information Act is your friend.

And never forget, 87.3% of statistics are made up on the spot!"

_________________________________________________________

Addendum:
After a question from the audience, I did need to make clear that when you're pestering people about where their data is, be nice about it! Don't buttonhole people at parties or back them into corners. Instead of yelling "where's your data?!?" ask questions like: "Your work sounds really interesting. I'd love to know more, do you make your data available anywhere?" "Did you hear about this new data publication thing? Yeah, it means you can publish your data in a trusted repository and get a paper out of it to show the promotion committee." Things like that.

If you're talking the talk, don't forget to walk the walk.

Thursday, 13 June 2013

NFDP13: Panel 3.1 Citation, Impacts, Metrics

This was my title and abstract for the panel session on Citation, Impact, Metrics at the Now and Future of Data Publishing event in Oxford on 22nd May 2013.

Data Citation Principles
I’ll talk about data citation principles and the work done by the CODATA task group on Data Citation. I’ll also touch on the implications of data publication for data repositories and for the researchers who create the data.

And here is a write-up of my presentation notes:

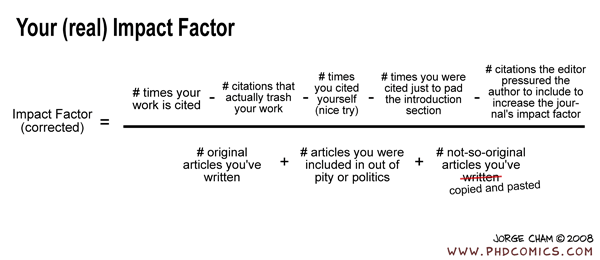
(No, I didn't have any slides - I just used the above PhD comic as a background)

"Hands up if you think data is important. (Pretty much all the audience's hands went up) That's good!
Hands up if you've ever written a journal paper... (Some hands went up) ... and feel you've got credit. (some hands went down again)
Hands up if you've ever created a dataset... (less hands up).... and got credit. (No hands up!)
So, if data's so important, why aren't the creators getting the credit for it?

We're proposing data citation and publication as a method to give researchers credit for their efforts in creating data. The problem is that citation is designed to link one paper to another - that's it. And those papers are printed on and frozen in dead tree format. We've loaded citation with other purposes, for example attribution, discovery, credit. But citation isn't really a good fit for data, because data is so changeable and/or takes such a long time and so many people to create it.

But to make data publication and citation work, data needs to be frozen to become the version of record that will allow the science to become reproducible. Yes, this might be considered a special case of dealing with data, but it's an important one. The version of record can always link to the most up-to-date version of the dataset after all.

Research is getting to be all about impact - how a researcher's work affects the rest of the world. To quantify impact we need metrics. Citation counts for papers are well known and well established metrics, which is why we're piggybacking on them for data. Institutions, funders and repositories all need metrics to support their impact claims too. For example a repository manager can use citation to track how researchers are using the data downloaded from the repository.

The CODATA task group on data citation is an international group. We've written a report: "Citation of data: the current state of practice, policy and technology". It's currently with the external reviewers and we're hoping to release it this summer. It's a big document ~190 pages. In it there are ten data citation principles: 

  1. Status of Data: Data citations should be accorded the same importance in the scholarly record as the citation of other objects. 
  2. Attribution: A citation to data should facilitate giving scholarly credit and legal attribution to all parties responsible for those data.
  3. Persistence: Citations should refer to objects that persist. 
  4. Access: Citations should facilitate access to data by humans and by machines.
  5. Discovery: Citations should support the discovery of data. 
  6. Provenance: Citations should facilitate the establishment of provenance of data.
  7. Granularity: Citations should support the finest-grained description necessary to identify the data. 
  8. Verifiability: Citations should contain information sufficient to identify the data unambiguously. 
  9. Metadata Standards: A citation should employ existing metadata standards.
  10. Flexibility: Citation methods should be sufficiently flexible to accommodate the variant practices among communities.
            None of these are particularly controversial, though as we try citing more and more datasets, the devil will be in the detail.

            Citation does have the benefit that researchers already are used to doing it as part of their standard practice. The technology also exists, so what we need to do is encourage the culture change so data citation is the norm. I think we're getting there."

            The Now and Future of Data Publishing - Oxford, 22 May 2013

            Book printing in the 15th Century - Wikimedia Commons
            Book printing in the 15th century - Wikimedia Commons

            St Anne's College, Oxford, was host to a large group of researchers, librarians, data managers and academic publishers for the Now and Future of Data Publishing symposium, funded by the Jisc Managing Research Data programme in partnership with  BioSharing, DataONE,  Dryad, the International Association of Scientific, Technical and Medical Publishers, and  Wiley-Blackwell.

            There was a lot of tweeting done over the course of the day (#nfdp13) so I won't repeat it here. (I've made a storify of all my tweets and retweets - unfortunately storify couldn't seem to find the #nfdp13 tweets for other people, so I couldn't add them in.) I was also on two of the panels, so may have missed a few bits of information there - it's hard to tweet when you're sitting on a stage in front of an audience!

            A few things struck me about the event:

            • It was really good to see so many enthusiastic people there!
            • The meme on the difference between *p*ublication (i.e. on a blog post) and *P*ublication (i.e. in a peer-reviewed journal) is spreading.
            • I've got a dodgy feeling about the use of "data descriptors" instead of "data papers" in Nature's Scientific Data - it feels like publishing the data in that journal doesn't give it the full recognition it deserves. Also, as a scientist, I want to publish papers, not data descriptors. I can't report a data descriptor to REF, but I can a data paper.
            • It wasn't just me showing cartoons and pictures of cats
            • I could really do with finding the time to sit down and think properly about Parsons' and Fox's excellent article Is Data Publication the Right Metaphor? (and maybe even the time to write a proper response).
            • Only archiving the data that's directly connected with a journal article risks authors only keeping the cherry-picked data they used to justify their conclusions. Also it doesn't cover the vast range of scientific data that is important and irrepreducible, but isn't the direct subject of a paper. Nor does it offer any solution for the problem of negative data. Still, archiving the data used in the paper is a good thing to do - it just shouldn't be the only archiving done.
            • Our current methods of scientific publication have worked for 300 years - that's pretty good going, even if we do need to update them now!
            I'll write up my notes for what I said in each of my panels - stay tuned!

            Monday, 8 April 2013

            Musings on data and identifiers, prompted by a visit to the Ashmolean Museum, Oxford


            Flint handaxe

            So, it being the Easter school holidays, we all went for a family outing to the Ashmolean Museum in Oxford. And within about two minutes (because I am a geek) I started spotting identifiers and thinking about how the physical objects in the museum are analogous to datasets.

            Take for example the flint handaxe pictured above. It's obviously a thing in its own right, well defined and with clear boundaries. But in a cabinet full of other artifacts (even some other hand axes) how can you uniquely identify it? Well, you can stick a label next to it (the number 1) and then connect that local identifier to some metadata on display in the case:

            Metadata for the flint handaxe (1.)
            That works, but it means that the positions of the artifacts are fixed in the case, so reorganising things risks disconnecting the object from its metadata. The number 1 is only a local identifier too - there were plenty of other cases in the gallery which all had something in there with the number 1 attached to it - so as a unique identifier it's not much good. And in this case, there were actually 2 handaxes identified with the number 1.

            If you look closely at the surface of the handaxe, you'll see a number written on it in black ink 1955.439a This number (which I'm guessing is an accession number with the year the artifact was first put into the museum as the first part) is also repeated in small print at the end of the metadata blurb.

            So, the moral from this example is that local identifiers are useful, but objects really do need unique identifiers which are present in both the dataset/artifact itself, and its corresponding metadata.


            Sobek
            Here we have a large, well defined dataset - sorry - artifact (and a pretty impressive one too!) There's isn't another statue of Sobek this size (or at all as far as I could see) in the Ashmolean museum. So it could be identified as "the restored statue of Sobek in the Ashmolean museum", and you'd probably get away with that as most people would know that's the one you meant.

            Sobek's identifier
            But it too still has an identifier, and it's right there on his shoulder, not hidden underneath where people can't see it.

            Sobek's metadata
            And it's also connected with his metadata.

            A collection from an A-Group burial
            In this case we have a dataset that's a collection of other self-contained datasets. Each dataset/pot has its own individual value, but has greater value as part of the larger collection. These particular datasets were all found in the same location at the same time, so have a very definite connection - they were all grave good excavated from on grave in Farras, Sudan.
            Close up of some of the grave goods
            Just because a dataset is part of a larger data collection, it doesn't mean the dataset has to be exactly the same as its fellows - in fact a wide variety of stuff makes the collection more valuable. Note though that the storage for the whole collection (i.e. the cabinet) has to take into account the different sizes and different display needs for each of the individual datasets/artifacts.

            And of course, each of the artifacts has its own id (sort of - the group of 7 semi-precious stones only has one id between them) as well as a local identifier to link it to its metadata.


            Collection metadata and individual item metadata
            The collection itself has its own metadata too, which puts the individual items' metadata into context.

            Non textual metadata

             And it also has metadata that is better expressed in the form of graphics rather than text - the diagram of the goods where they were found in the grave and an actual photo. These figures too have their own metadata in their captions - so we've got metadata about metadata happening here, and all of it is important to keep and display.

            Faience Shabtis
            Here we have a data collection that is joined by theme rather than by geographic location. These statues are all shabtis, but came from different places and were ingested into the museum at different times.

            Faience shabti metadata (15.)
            They all have unique ids though, and in the case of this data collection, only the collection metadata is displayed. I'd imagine though that if you went looking in the museum records, you'd find information on each of the individual shabti, filed under their id.

            With digital data we've got it easier in one way, in that the same dataset/shabti can be in multiple collections at the same time and displayed in lots of different ways in different places. The downside is that it can be hard to know exactly what dataset is being displayed where and is part of what collection. That's why the permanent, unique ids are so vital to keep track of things.

            Granularity issue! Mosaic tiles
            And here we have a classic granularity issue - a pile of mosaic tiles. In theory, you could write a unique id on each on of these tesserae (might be a bit fiddly), but then you'd have to put each of those ids into the metadata. Which, given that the value of these tiles aren't in themselves as individual objects, but in the whole collection, I can understand why the museum curators decided to label them as one thing.

            Metadata for the mosaic tiles (49.)
            Because the dataset is in lots of pieces (files), none of which is uniquely identified, there is always the risk that a piece may become detached from its collection and lost/misidentified. Moving this particular dataset around the place could be quite problematic - but on the other hand, there's so many pieces that losing one or two in  transit might not be too much of a problem. On issues of granularity, data repository managers, like museum curators, need to decide themselves how they're going to deal with their datasets/artifacts.

            Silver ring, temporarily removed
            And finally, what do you do if you've published a dataset, but have to take it down for whatever reason? Simple - leave the metadata about the dataset intact, and stick a note on it saying what was removed, who removed it and when. There was another one of these notices that I spotted (but didn't photograph) which gave the reason for the removal (restoration) and also a photo of the artifact, all on the little "Temporarily removed" card.

            I think we worry about data a lot, because it's so hard to draw distinct lines around what is and what isn't a dataset. But honestly, there's such a wide variety of stuff in museums that all have identifiers and methods of curation that I really do think we need to worry less about how to turn a dataset into a standardised book, and think of them more as artifacts/things that come in all sorts of shapes and sizes.

            Oh, and if you're in Oxford, do go check out the Ashmolean museum. It's great, and has lots more stuff than just the pieces I took photos of!